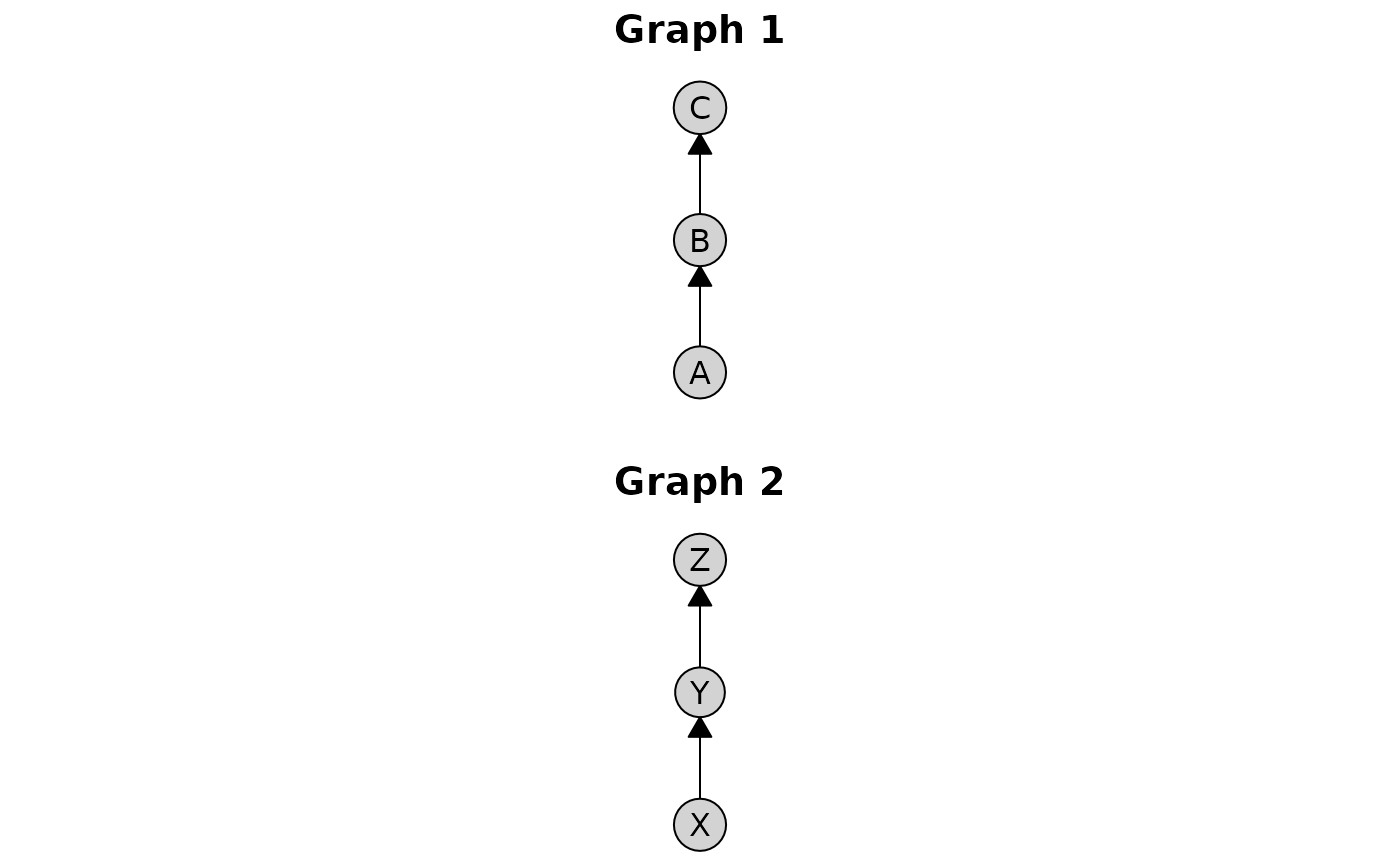
Stack two plots vertically with configurable spacing. Compositions can be nested to create complex multi-plot layouts.
Details
The spacing between plots is controlled by the global option
caugi_options()$plot$spacing, which defaults to grid::unit(1, "lines").
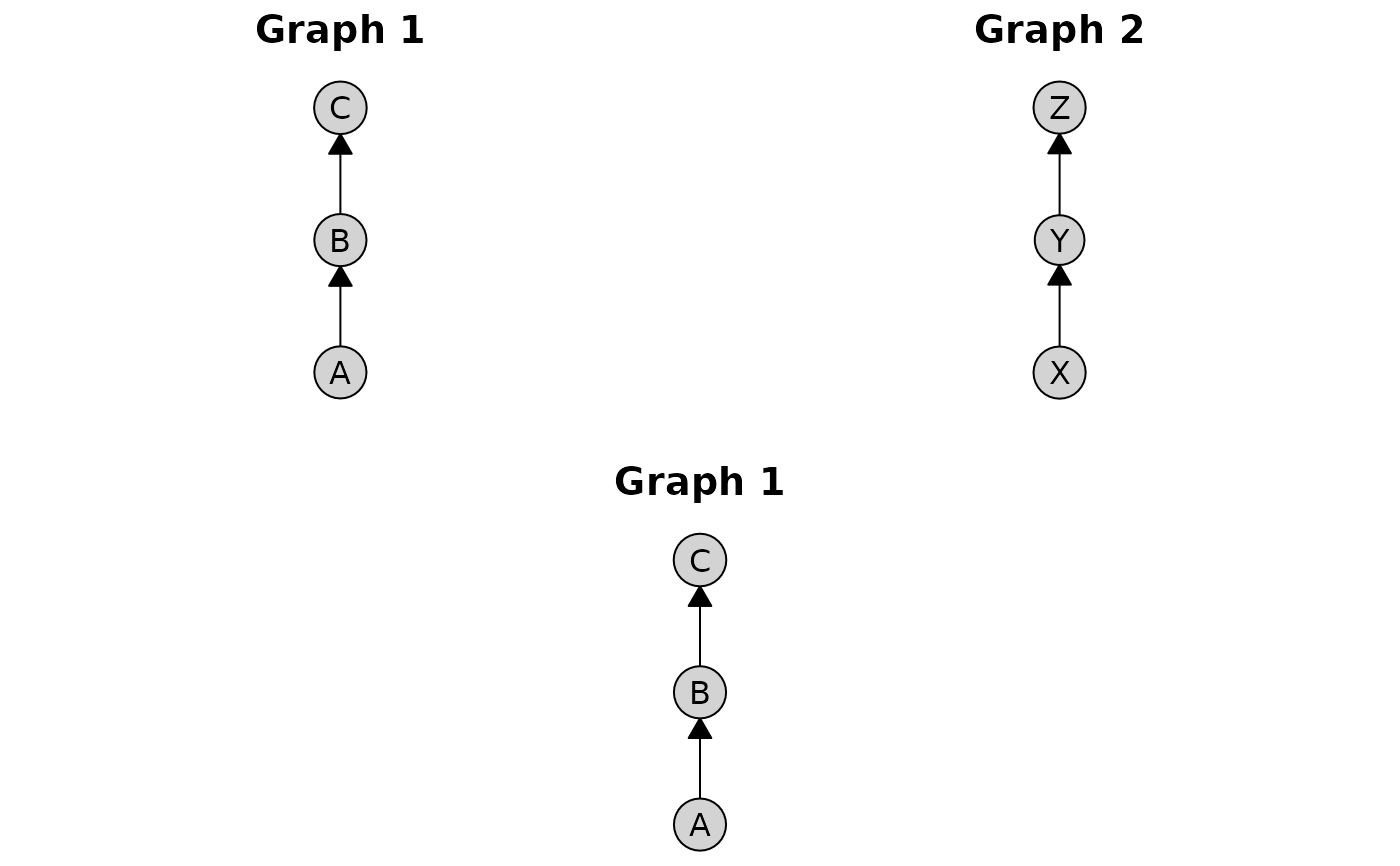
Compositions can be nested arbitrarily:
p1 / p2- two plots stacked verticallyp1 / p2 / p3- three plots in a column(p1 + p2) / p3- two plots on top, one below
See also
caugi_options() for configuring spacing and default styles
Other plotting:
add-caugi_plot-caugi_plot,
caugi_layout(),
caugi_layout_bipartite(),
caugi_layout_circle(),
caugi_layout_fruchterman_reingold(),
caugi_layout_kamada_kawai(),
caugi_layout_sugiyama(),
caugi_layout_tiered(),
caugi_plot(),
plot()